

It starts at the bedside
Margaret waited nineteen hours in the Emergency Department (ED). She was frightened, couldn’t get to a toilet unaided and didn’t fully comprehend what was going on. Her grand daughter had already rung twice for an update. The decision to admit was made hours earlier, but a bed on the ward wasn’t available yet.
At the same time, the operational bed manager reported that the site, although still tight, was slightly better than the previous week. Going into the evening, they acknowledged the delay getting a few frail patients up to the ward. Those patients had long since breached 12 hours; Margaret was one of them.
Four boxes
My general observation, as a CQC inspector, is that genuine clinically led services are rare. Although the usual explanation is that managers have taken over, I think something much more interesting is happening. It happened to Margaret on her way up through the organisation, and understanding what happened might settle what we actually mean by clinically led.
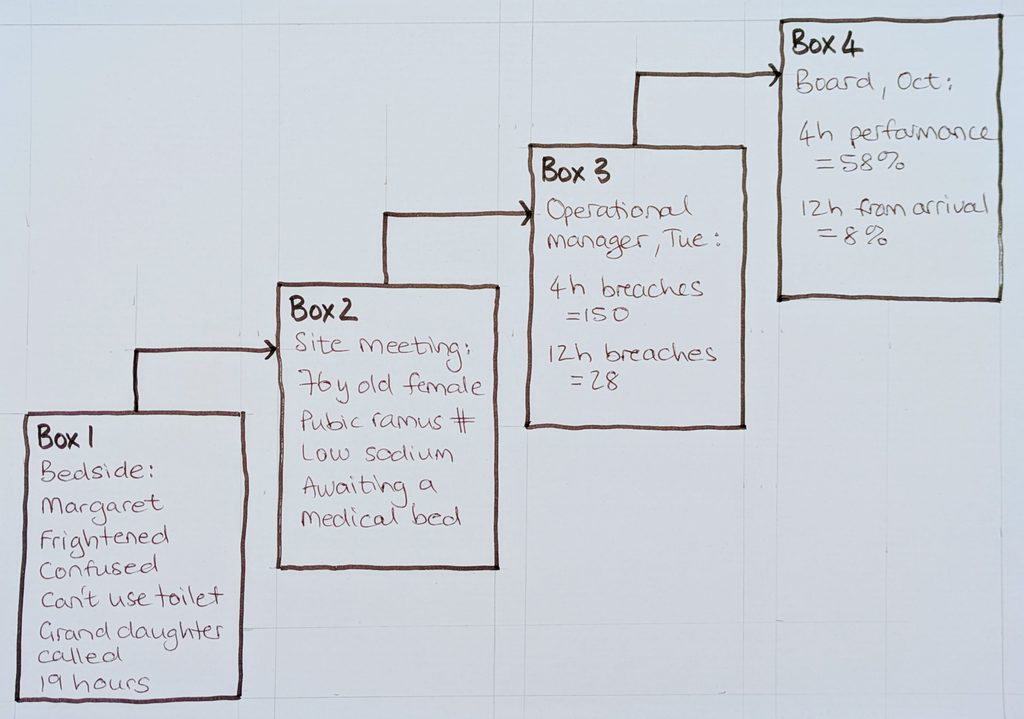
Four boxes rising stepwise. At the bedside she is Margaret: frightened, distressed and confused, with a workup completed, waiting for an inpatient bed (box 1). At the bed meeting she is the breach in a Majors cubicle (perhaps a corridor) waiting for a bed (box 2). Still one person, still in a known place, still someone you could walk down and talk to. In the operational service manager’s report she is one entry in the day’s breach analysis (box 3). And at the monthly board meeting she is a tiny portion of the four and twelve hour performance for the month (box 4).
The process is called abstraction. And ironically each one of these transformations is necessary. You cannot run a board meeting holding the box 1 version of every patient; nobody involved has done anything wrong.
But it would also be folly not to acknowledge that some things changed on the way up. And it is here, on the way up, where clinically led usually starts to come apart. I’ve identified four things that change on the way up, and one on the way back down that doesn’t, to help contextualise what clinically led means.
What thins on the way up
Abstraction takes more than one form. What thins is the simplest. Something is dropped at every step on the way up. And what gets dropped is disproportionately the things that are harder to count: patient experience, staff moral injury and delayed drug rounds for example.
The layers also compound. Each one is built from the layer below rather than directly from Margaret in box 1. So what arrives at the top is an abstraction of an abstraction, several transformations deep. Each only as good as the one before.
In our example, Margaret becomes invisible somewhere between boxes 2 and 3, between the bed meeting and the breach analysis. Up to box 2 you can still identify her, if you try. But by box 3 she is no longer recoverable; and has become an instance of a category.
What inverts on the way up
Not everything thins. Some things invert on the way up.
Slack is probably the best example. At the bedside, slack is the necessary system capacity to absorb a bad day; the thing that lets an ED handle variation without harming anyone. That means hospital occupancy around 85%,* so that inpatient capacity can allow admitted flow from ED into the hospital unimpeded.
But at the board level, 15% slack appears as unused resource. An empty bed reads as inefficiency. Given the state of elective recovery, it is hard not to see it that way. And as an aggregate measure (one number standing in for several separate events) occupancy is built to find, and remove, exactly that kind of spare capacity.
Averaging also deletes the days the hospital ran out of space. A month at say 93% inevitably contains days at 100%. Although a jam happened on those days, the report only shows the tolerable mean, with the beds that could have absorbed it already counted as waste.
Inverting also resists correction. Removing slack produces a visible saving almost immediately; the cost only arrives later as breaches.
So the decision that follows is not a degraded version of the right one. It is the opposite of it, made in good faith, from a representation that inverted the sign of the thing being decided about.
What inverts in time
The same inversion happens across time (and this one could happen even if the decision maker stood at the bedside).
ED clinicians see patients as unfolding uncertainty. Although most ED patients go home, they get there through a process that could have gone either way at several points. The CT that excluded the bleed, six hours of observation, bloods needed at specified intervals and so on.
The discharge summary, however, is only written after the uncertainty resolved, and it contains mainly the outcome. So the investigation that ruled something out reads as an investigation that found nothing. And a reasonable person considering admission or ambulance conveyance avoidance afterwards, reasonably asks if all of that was necessary.
It is a fair question asked of a record that cannot answer it. The work of course was justified by futures that did not happen, but those don’t leave the same trace.
In principle, clinicians do not judge a clinical decision by its outcome. We judge it by what was reasonable, given what was available at the time. We apply that rigorously to each other at M&M and in clinical review, but almost never to operational review.
The record is what travels upward, so every box after the first is built from a version of the truth that contains less and less uncertainty.
What gets added on the way up
Some things are added.
Each layer is accountable for what it reports, so each report tends to arrive with a recovery plan attached. Although nobody lies, a recovery plan carries optimism in a way that 28 twelve hour breaches do not. It therefore travels better than the thing it was written about.
Good news survives the journey intact. Bad news acquires mitigation.
Repeat that at every layer and what arrives at the top is true in every detail, and unrecognisable as a whole. The view from the board is not only thinner than the view from the floor, it is systematically more reassuring.
What comes back down
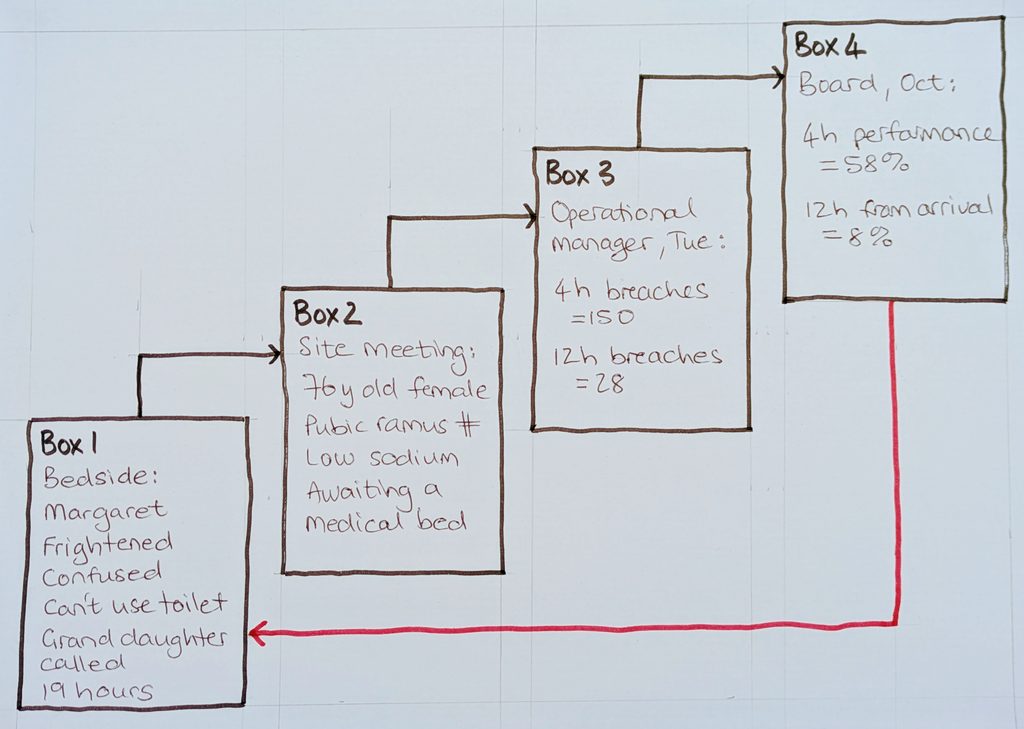
On the way up, what we know about Margaret thinned, inverted and acquired recovery plans at every step.
On the way down, a decision arrives whole. It carries the reasoning of the box it was made in, built from what was left of her by the time it got there. Then it lands at the bedside; on the Margaret in box 1.
Sometimes directly. More often through things that change around her. A bed protected to keep the elective list moving, a rota gap left to the last minute because attendances might settle, or an escalation area withdrawn after a good quarter.
None of it was decided about her; yet she carries the consequence of the decisions.
Defining clinically led
Clinically led is not about clinicians being in charge, and it is not about intending what is best for the patient. Everyone from the bedside to the board intends what’s best. It is about where decisions are made. Specifically, whether they are made close enough to the patient so that the person deciding can be corrected by the outcome of their decisions.
Correction is the critical word, and it is why the definition survives the objection that clinicians cannot hold every decision. They should not. Some decisions belong with finance or the exec.
The question is whether whoever holds accountability for a decision is exposed to the outcome closely enough, and soon enough, to correct course.
Summary
The clinical in clinically led points at the bedside, in box 1; that’s where the Margarets are. But the truth is that a great deal of what happens to the Margarets in box 1 is decided three boxes away, by people working from numbers, reports and operational jargon.
Narrowing that distance is what makes a service clinically led.
* Note: The 85% ceiling is long established. The National Audit Office found that occupancy above 85% brings regular bed shortages, periodic bed crises and more hospital acquired infection. The original modelling is Bagust and colleagues in the BMJ in 1999. More recent empirical work across English hospitals found mortality higher where occupancy runs above 90% and lower below 85%. NICE settled on a pragmatic 90%, NHS England plans to 92%, and we run at around 93%.
How this post was written: This post started as preparation for a talk for our ED consultant away day three months ago. The thinking was developed over a much longer time from personal observation and experience, curated through several exchanges with Claude (Anthropic) and subsequently further refined through multiple discussions with peers. Set up to challenge rather than agree, I used Claude as a sparring partner, not as a ghostwriter. It challenged my framing, supplied some of the background and summarised sections from our exhanges which I then rewrote. The argument, the themes, examples and any errors are all mine. I checked the references and created the figures myself.
